
WANTED: Individual or team to take over this project. I'm in my 70's and want to put my feet up. Contact details in footer.
| AS Level >Timing< RC Timing Schmitt NOT Astable |
Timing |
|
Use a resistor and a capacitor to make a timing circuit.
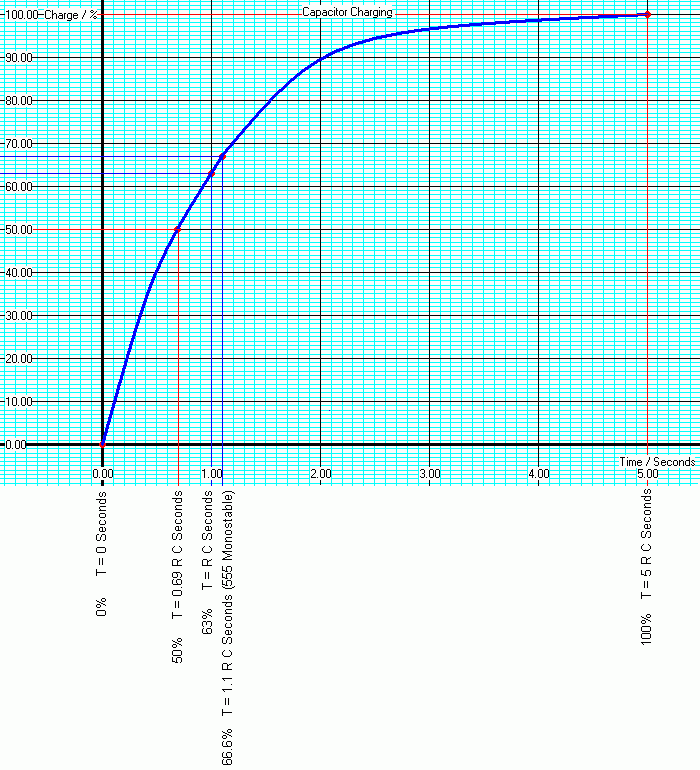
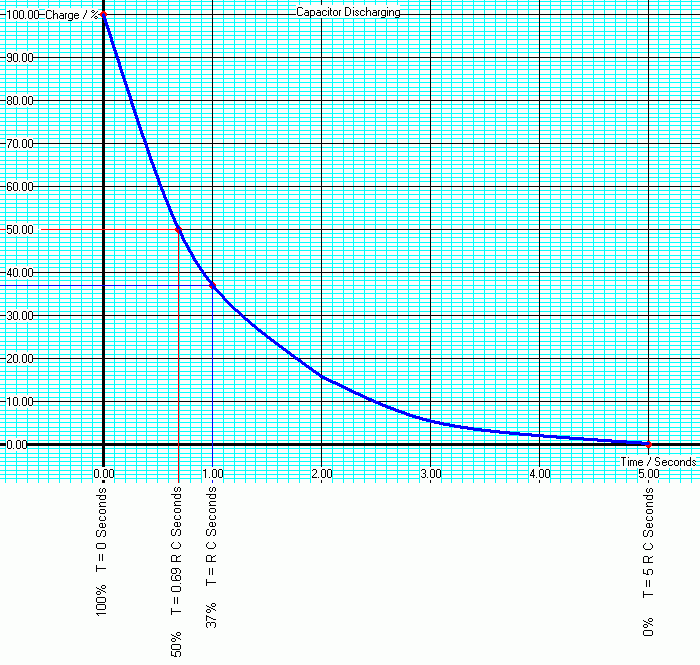
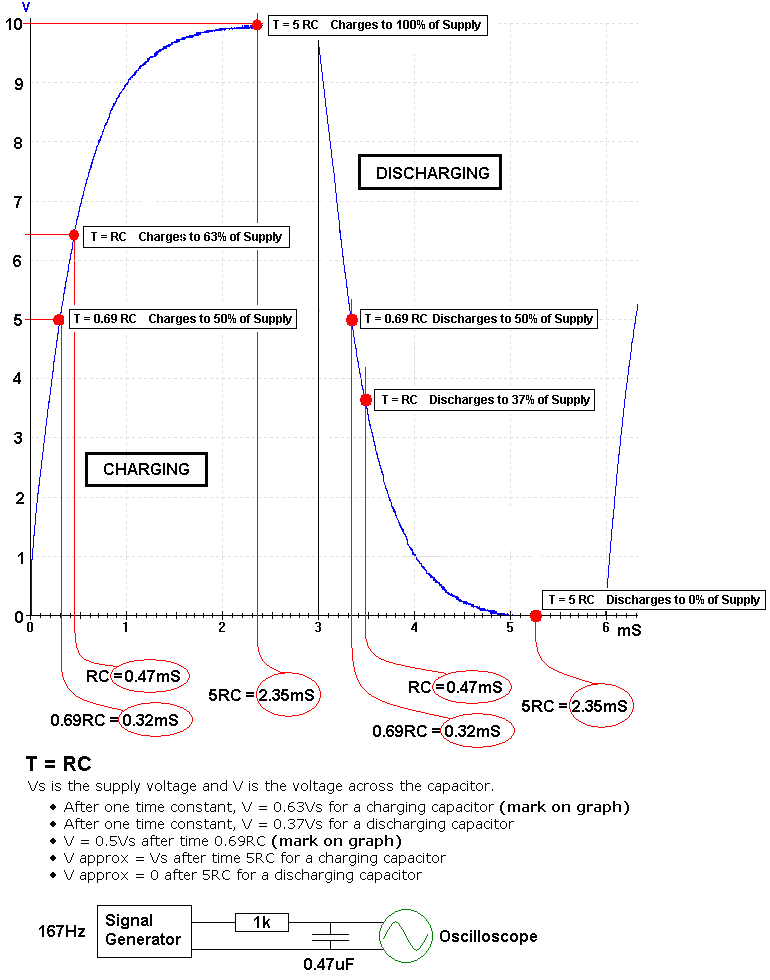
Time Constant: T = R C = The time for the capacitor to charge or discharge by 63%.
View the RC timer in the Lushprojects Simulator
The time constant calculations below are needed for designing timing circuits.
In this circuit, when the switch is flipped, the voltage across the capacitor changes quite fast and the current flowing is larger. As the capacitor approaches full charge (or discharge) the voltage changes more slowly and the current is smaller. The current is proportional to the rate of change of voltage.
Here is a Flash animation of a water analogy. The container represents the capacitor. It takes time to fill or empty. When the tank is nearly full or empty, the level changes much more slowly. Capacitors behave the same way.
|
|
| 0% | T = 0 Seconds |
| 50% | T = 0.69 R C Seconds |
| 63% | T = R C Seconds |
| 66.6% | T = 1.1 R C Seconds (555 Monostable) |
| 100% | T = 5 R C Seconds |
|
|
| 100% | T = 0 Seconds |
| 50% | T = 0.69 R C Seconds |
| 37% | T = R C Seconds |
| 0% | T = 5 R C Seconds |
The aim is to measure the voltage across a charging capacitor at regular time intervals. Once the capacitor is fully charged, repeat the measurements while it is discharging. These results should be plotted on a graph. The graph should then be marked up with the key positions listed above.
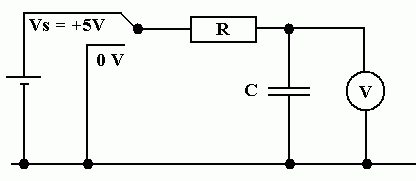
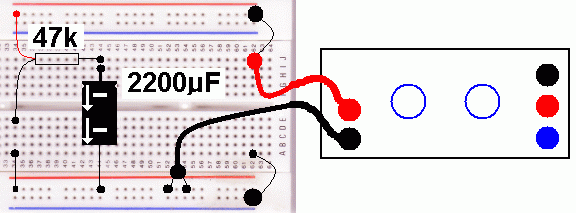
Charging ...
Discharging
Subject Name Level Topic Name Question Heading First Name Last Name Class ID User ID
|
Q: qNum of last_q Q ID: Question ID Score: num correct/num attempts Date Done
|
Question Text
image url
Help Link
Add Delete Clone Edit Hardness
Contact, Copyright, Cookies and Legalities: C Neil Bauers - reviseOmatic V4 - © 2016 to 2026
Hosted at Akamai Cloud - London
Please report website problems to Neil